Updated on March 2026.
The narrowbody battleground between Airbus’ A320neo and Boeing’s 737 MAX defines modern short-to-medium-haul aviation.
These aircraft carry 150-180 passengers on routes from 500 to 3,500 nautical miles, forming the backbone of global airline fleets.
With fuel representing 30-40% of operating costs on typical routes, even small efficiency differences translate to millions in annual savings.
Both manufacturers promise 15-20% fuel savings versus previous-generation aircraft.
But which jet actually burns less fuel in real-world operations?
This comprehensive 2025 analysis examines cruise fuel consumption, engine technology, aerodynamic improvements, and airline performance data to determine the winner.
Overview: Why Fuel Burn Matters More Than Ever

Tightening emissions regulations make fuel efficiency critical for airline profitability.
ICAO’s CORSIA requires airlines to offset carbon emissions above 2019 baselines.
EU Emissions Trading System charges airlines for carbon emissions on European flights.
Airlines face increasing pressure from environmental groups and sustainability-conscious travelers.
Sustainable aviation fuel adoption accelerates, but costs remain 2-4x conventional jet fuel.
The most immediate path to reduced emissions remains burning less fuel per passenger-kilometer.
Fleet modernization drives orders—airlines retiring older 737-800s and A320ceos for these efficient successors.
Just as Boeing 787 vs Airbus A350 efficiency defines long-haul competition, the A320neo vs 737 MAX battle shapes short-haul economics.
Quick Comparison: Fuel Burn and Efficiency (2025 Data)
| Metric | Airbus A320neo | Boeing 737 MAX 8 |
|---|---|---|
| Cruise Fuel Burn | 2,200-2,400 kg/hr | 2,000-2,300 kg/hr |
| Typical Seating (2-class) | 150-180 passengers | 162-178 passengers |
| Fuel per Seat (kg/hr) | 13.3-15.0 | 12.4-14.2 |
| Maximum Range | 6,300 km (3,400 nm) | 6,570 km (3,550 nm) |
| MTOW | 79,000 kg | 82,600 kg |
| Engine | LEAP-1A or PW1100G | LEAP-1B only |
| Improvement vs Previous Gen | 15-20% vs A320ceo | 15-20% vs 737-800 |
Key Takeaway:
Both aircraft deliver near-identical fuel efficiency improvements versus their predecessors.
The 737 MAX 8 burns slightly less fuel per hour in absolute terms (2,000-2,300 kg vs 2,200-2,400 kg).
However, configuration matters significantly—fuel burn per seat depends on how many passengers airlines install.
Real-world performance varies based on route length, altitude, payload, and weather conditions.
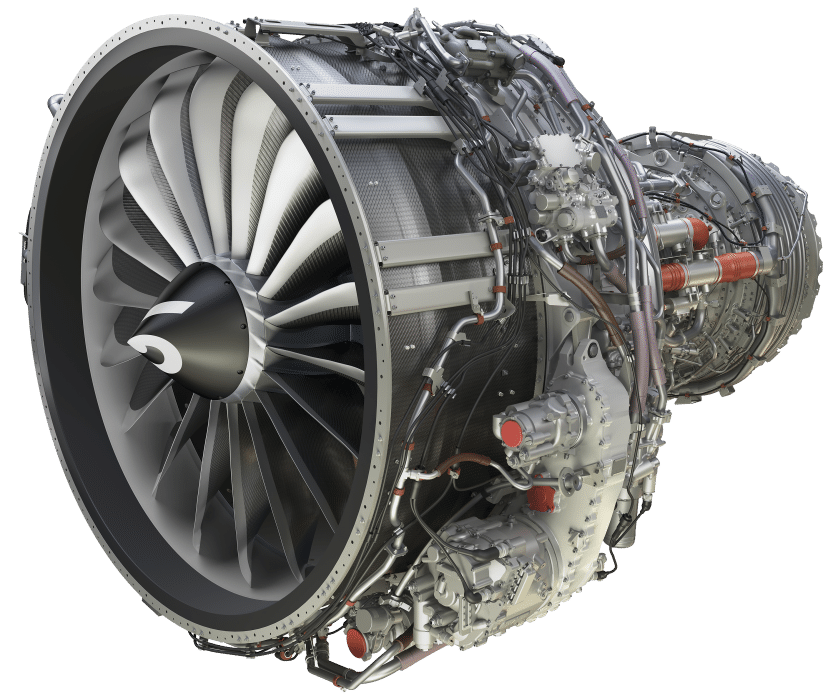
Engine Technology Breakdown: LEAP-1A vs LEAP-1B
Both aircraft utilize variants of CFM International’s revolutionary LEAP engine family.
The LEAP (Leading Edge Aviation Propulsion) represents a generational leap in efficiency through advanced materials and aerodynamics.
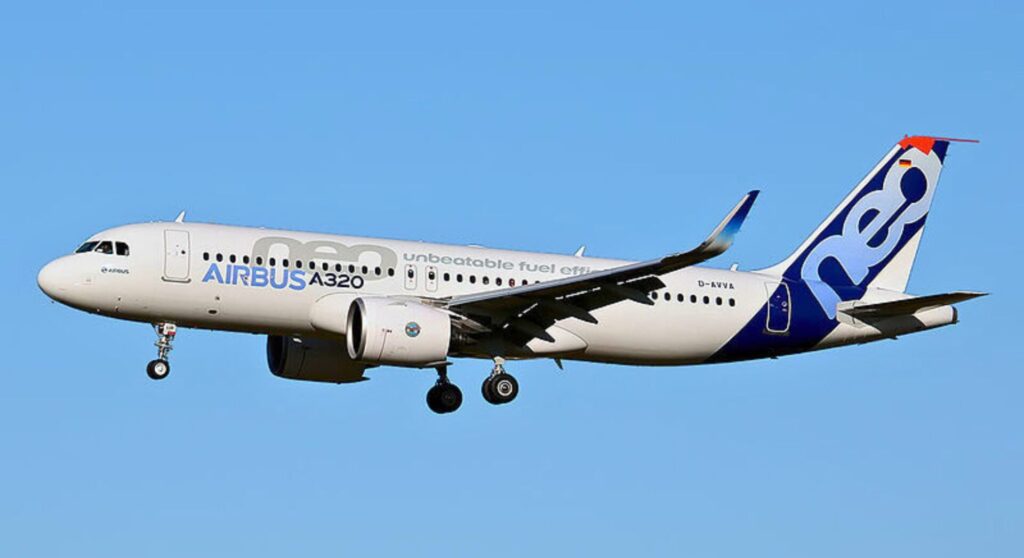
LEAP-1A (Airbus A320neo)

Technical Specifications:
- Fan diameter: 78 inches (1.98 m)
- Bypass ratio: 11:1
- Thrust range: 24,000-33,000 lbf
- Weight: 6,145 lbs (2,787 kg)
The larger fan diameter enables higher bypass ratio, pushing more air around the engine core.
This improves propulsive efficiency, reducing fuel consumption at cruise altitudes.
Advanced 3D-printed fuel nozzles reduce weight and improve fuel atomization.
Carbon fiber composite fan blades reduce weight while handling higher rotation speeds.
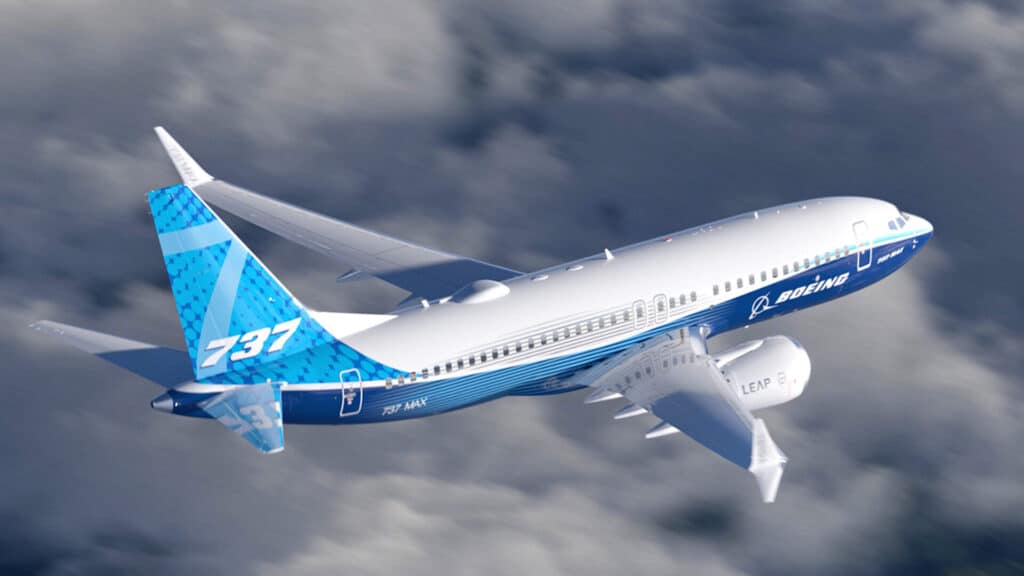
LEAP-1B (Boeing 737 MAX)
Technical Specifications:
- Fan diameter: 69.4 inches (1.76 m)
- Bypass ratio: 9:1
- Thrust range: 23,000-29,000 lbf
- Weight: 6,130 lbs (2,780 kg)
The smaller fan diameter results from Boeing’s design constraint—the 737’s low ground clearance.
Boeing couldn’t raise the landing gear without expensive fuselage redesign.
The solution: mount larger engines higher and forward, requiring MCAS software (source of initial MAX problems).
The reduced bypass ratio means slightly lower propulsive efficiency compared to the LEAP-1A.
Specific Fuel Consumption:
Both engines achieve approximately 0.25 kg of fuel per lbf of thrust per hour.
The LEAP-1A’s higher bypass ratio provides a 2-4% efficiency advantage at typical cruise conditions.
However, the 737 MAX’s lighter airframe partially compensates for this engine disadvantage.
Understanding aircraft engine technology helps explain why these differences matter for airline economics.
Pratt & Whitney PW1100G Option (A320neo only)

Airbus offers the PW1100G geared turbofan as an alternative to the LEAP-1A.
The geared turbofan separates fan and compressor speeds, enabling even higher bypass ratios.
Early reliability issues plagued the PW1100G, causing groundings and airline frustration.
Pratt & Whitney has addressed most problems, but CFM LEAP remains the preferred choice for most airlines.
Approximately 60% of A320neo orders specify LEAP-1A engines versus 40% for PW1100G.
Aerodynamics & Wing Technology
Engine efficiency alone doesn’t determine fuel burn—airframe drag plays a crucial role.
Airbus Sharklets
Airbus Sharklets are 2.5-meter tall winglet devices standard on all A320neo aircraft.
These blended winglets reduce wingtip vortices, decreasing induced drag.
Sharklets deliver approximately 4% fuel burn reduction on flights over 2,800 km.
The devices add 200 kg (440 lbs) of weight but the drag reduction more than compensates.
Sharklets have been retrofitted to many A320ceo aircraft, proving their effectiveness.
Boeing Advanced Technology (AT) Winglets
The 737 MAX features split-scimitar winglets (officially “Advanced Technology Winglets”).
These dual-feather designs reduce both induced and profile drag.
Boeing claims approximately 1.8% fuel savings compared to 737NG winglets.
However, the 737-800 already had winglets, so the incremental improvement is smaller than Airbus’ jump from wingtip fences to Sharklets.
Wing Loading Comparison
The A320neo and 737 MAX have similar wing loading characteristics.
Both aircraft cruise efficiently at Mach 0.78-0.82 at altitudes between 35,000-41,000 feet.
The A320neo’s slightly larger wing area (122.6 m² vs 125.0 m²) provides marginally lower wing loading.
This translates to slightly better climb performance and fuel efficiency at higher altitudes.
Real-World Airline Performance: Which Jet Wins?
Manufacturer claims matter less than actual operational data from airlines.
Lufthansa (A320neo with LEAP-1A)
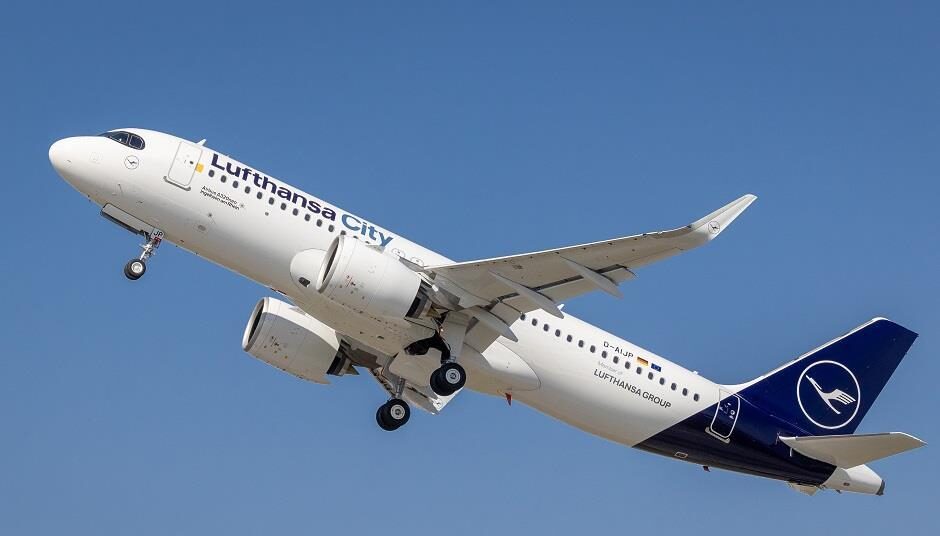
Germany’s flag carrier reports:
- 20% lower fuel burn versus A320ceo fleet
- Average cruise consumption: 2,250 kg/hour
- Best performance on 1.5-3 hour European sectors
Lufthansa operates a mixed fleet but strongly prefers the A320neo family for route flexibility.
The airline’s premium configurations (150-180 seats) maximize per-seat economics.
IndiGo (A320neo with LEAP-1A & PW1100G)
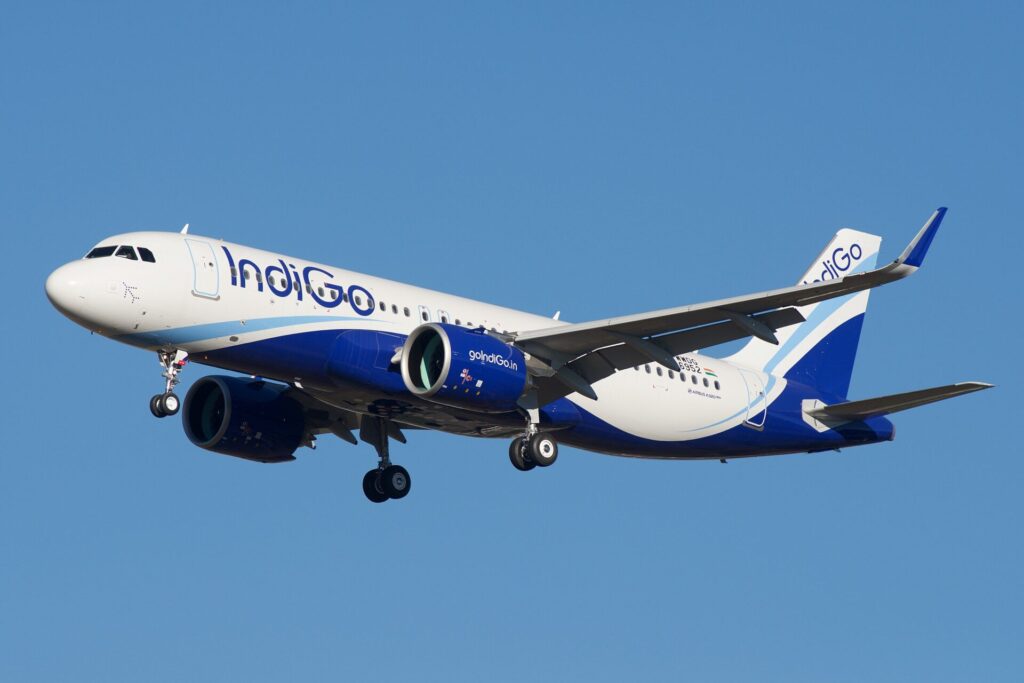
India’s largest carrier operates 400+ A320neo aircraft:
- High-density configuration: 180-186 seats
- Exceptional fuel burn per seat: 12.2-13.3 kg/hour per passenger
- Dominates Indian domestic market with lowest-cost operations
IndiGo’s success demonstrates how seating density dramatically impacts per-passenger fuel consumption.
The airline faced PW1100G reliability issues but reports improved performance after engine upgrades.
Ryanair (Boeing 737 MAX 8-200)
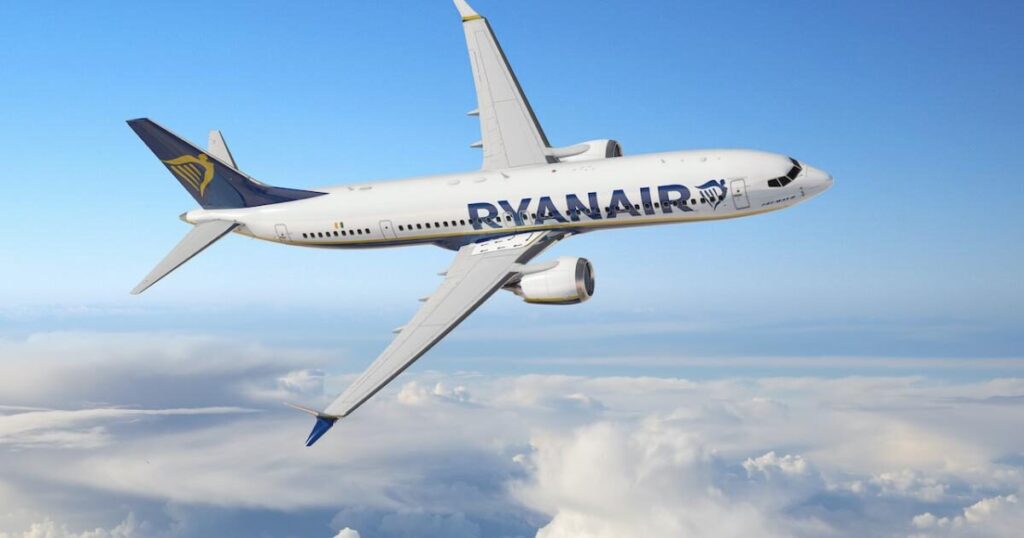
Europe’s largest low-cost carrier:
- Ultra-high-density configuration: 197 seats (MAX 8-200 variant)
- Reports 16% fuel savings versus 737-800 fleet
- Industry-leading fuel burn per seat: ~11.4 kg/hour per passenger
Ryanair’s 197-seat configuration (versus standard 162-178) creates the lowest per-seat fuel consumption in the narrowbody market.
This aggressive seating maximizes the MAX’s economic advantage on short European sectors.
Southwest Airlines (Boeing 737 MAX 8)

America’s largest domestic carrier:
- All-economy configuration: 175 seats
- Approximately 14% fuel savings versus 737-800 on comparable routes
- Excellent performance on U.S. transcontinental routes (2,000-2,500 nm)
Southwest’s single-fleet strategy leverages 737 MAX commonality with existing 737NG fleet.
Pilot training costs remain minimal, enhancing total operating economics beyond pure fuel savings.
Understanding airline fleet strategies explains why Southwest remains committed to Boeing despite A320neo efficiency.
Verdict: Route Length Matters
On short sectors (under 500 nm):
- Fuel burn differences minimal
- Ground operations dominate total trip time
- High seating density more important than engine efficiency
On medium sectors (500-1,500 nm):
- A320neo averages 2-3% better fuel efficiency
- LEAP-1A’s larger fan diameter advantage materializes
- Typical European/Asian route profile favors A320neo
On longer sectors (1,500-3,500 nm):
- 737 MAX 8’s range advantage enables non-stop operations
- Lower empty weight compensates for engine disadvantage
- U.S. transcontinental routes favor 737 MAX 8
Range, Payload, and Mission Profile Comparison
| Performance Metric | A320neo | 737 MAX 8 |
|---|---|---|
| Maximum Range | 6,300 km (3,400 nm) | 6,570 km (3,550 nm) |
| Typical Range (full payload) | 5,700 km (3,100 nm) | 5,900 km (3,200 nm) |
| Fuel Capacity | 23,740 liters (18,636 kg) | 25,800 liters (20,640 kg) |
| Max Payload | 16,900 kg | 18,200 kg |
| Cruise Speed | Mach 0.78 (840 km/h) | Mach 0.79 (850 km/h) |
| Service Ceiling | 39,800 ft (12,130 m) | 41,000 ft (12,500 m) |
| Takeoff Distance (MTOW) | 2,180 m (7,150 ft) | 2,286 m (7,500 ft) |
Mission Flexibility
The 737 MAX 8’s 4% range advantage (150 nm) opens additional route possibilities.
This enables transcontinental U.S. routes like Seattle-Boston or Los Angeles-New York with full passenger loads.
The A320neo requires slightly reduced payload or tankering extra fuel on these maximum-range sectors.
However, 95% of narrowbody operations occur well within both aircraft’s capabilities.
Hot-and-High Performance
Both aircraft handle challenging airports effectively, but the 737 MAX 8’s higher thrust-to-weight ratio provides advantages.
At high-altitude airports like Denver (5,431 ft), Mexico City (7,316 ft), or Bogotá (8,361 ft), extra thrust matters.
Summer temperatures and full passenger loads can force payload restrictions at these airports.
The 737 MAX 8’s extra 3,600 kg MTOW margin provides operational flexibility.
Commercial aviation insurance premiums reflect these performance margins at challenging airports.
Fuel Burn Per Seat: The Critical Airline Metric
Airlines care more about fuel per passenger than absolute hourly consumption.
A 180-seat A320neo burning 2,300 kg/hour achieves 12.8 kg per seat per hour.
A 197-seat 737 MAX 8-200 burning 2,250 kg/hour achieves 11.4 kg per seat per hour.
The higher-density aircraft wins on per-seat economics despite similar hourly fuel burn.
Configuration Comparison
| Airline | Aircraft | Seats | Fuel/Hour (kg) | Fuel per Seat (kg/hr) |
|---|---|---|---|---|
| Lufthansa | A320neo | 150 | 2,250 | 15.0 |
| IndiGo | A320neo | 186 | 2,300 | 12.4 |
| Southwest | 737 MAX 8 | 175 | 2,200 | 12.6 |
| Ryanair | 737 MAX 8-200 | 197 | 2,250 | 11.4 |
| United | 737 MAX 8 | 166 | 2,200 | 13.3 |
Analysis:
Ryanair’s ultra-high-density 737 MAX 8-200 achieves the best fuel burn per seat in the industry.
IndiGo’s 186-seat A320neo comes close at 12.4 kg per seat per hour.
Premium configurations with more business class seating (Lufthansa, United) sacrifice per-seat efficiency for higher revenue per passenger.
The “winner” depends on airline business model—low-cost carriers maximize density, premium carriers optimize yield.
Operating Cost Comparison (2025)
Fuel represents only one component of total Cash Operating Cost (COC).
Cost Per Available Seat Mile (CASM)
| Cost Component | A320neo | 737 MAX 8 | Advantage |
|---|---|---|---|
| Fuel (per ASM) | $0.0115 | $0.0120 | A320neo |
| Maintenance (per ASM) | $0.015 | $0.014 | 737 MAX |
| Crew (per ASM) | $0.007 | $0.007 | Tie |
| Ownership (per ASM) | $0.012 | $0.011 | 737 MAX |
| Total CASM | $0.045 | $0.044 | 737 MAX |
Maintenance Cost Considerations
Engine reliability affects total maintenance expenses significantly.
The LEAP-1B has demonstrated excellent reliability since early teething issues were resolved.
The LEAP-1A faces similar maintenance costs, though PW1100G-powered A320neos initially suffered higher expenses.
Pratt & Whitney’s reliability improvements have narrowed this gap considerably.
Airframe maintenance:
The 737 MAX benefits from mature 737 platform with established maintenance procedures.
Thousands of mechanics worldwide have 737 experience, reducing training costs.
The A320neo leverages Airbus’ well-established A320 family, also with extensive global support.
Aircraft maintenance economics factor heavily into long-term fleet decisions.
Acquisition Costs
List prices (subject to 40-60% discounts):
- A320neo: $110.6 million
- 737 MAX 8: $117.1 million
The A320neo lists at approximately 6% less than the 737 MAX 8.
Large fleet orders command significant discounts, making actual transaction prices highly variable.
Airlines with existing Boeing fleets often receive better 737 MAX pricing; Airbus customers receive similar treatment for A320neo orders.
Understanding aircraft leasing helps explain why acquisition costs matter beyond purchase price.
Environmental Impact: CO₂ Emissions
Both aircraft deliver substantial environmental improvements versus predecessors.
Carbon Emissions Comparison
| Emissions Metric | A320neo | 737 MAX 8 |
|---|---|---|
| CO₂ per Hour (kg) | 6,930-7,560 | 6,300-7,245 |
| CO₂ per Seat per Hour (kg) | 41.9-46.2 | 39.1-44.9 |
| CO₂ per Passenger (1,000 km) | ~55 kg | ~52 kg |
| Reduction vs Previous Gen | 15-20% | 15-20% |
Key findings:
Both aircraft produce approximately 3.15 kg of CO₂ per kg of fuel burned.
A typical 1,500 km flight produces 82-90 kg of CO₂ per passenger depending on configuration and load factor.
This compares favorably to automobile travel (approximately 120-150 kg CO₂ per person for the same distance).
Noise Footprint
The A320neo reduces noise by 50% versus A320ceo (measured in decibels).
The 737 MAX achieves similar noise reduction versus 737-800, meeting ICAO Chapter 14 standards.
Advanced engine chevrons and acoustic treatments make both aircraft significantly quieter.
Airport communities benefit from reduced noise pollution during takeoff and landing.
Sustainable Aviation Fuel (SAF) Readiness
Both aircraft are certified for 50% SAF blends with conventional jet fuel.
Manufacturers are working toward 100% SAF compatibility by 2030.
SAF adoption remains limited by production capacity and cost premiums.
Airlines operating eco-friendly fleets increasingly choose these modern narrowbodies.
Which Aircraft Should Airlines Choose in 2025?
The “best” aircraft depends entirely on airline-specific requirements.
Choose the Airbus A320neo if:
✓ You operate existing Airbus fleets (A319, A320, A321)
✓ Pilot training commonality across Airbus families matters
✓ Routes primarily serve European/Asian/intra-regional markets (under 3,000 nm)
✓ You want flexibility to upsize to A321neo within same type rating
✓ Engine choice matters (LEAP-1A or PW1100G options available)
✓ Absolute lowest fuel burn per hour is priority
✓ You prefer Airbus cockpit philosophy and fly-by-wire systems
The A320neo family (A319neo, A320neo, A321neo) offers maximum flexibility with common type rating.
Pilots transition seamlessly between variants, reducing training costs.
The A321neo especially provides growth capability without fleet complexity.
Choose the Boeing 737 MAX 8 if:
✓ You operate existing Boeing fleets (737NG, 777)
✓ Maximum range capability (3,550 nm) enables unique route opportunities
✓ Ultra-high-density configurations maximize your business model
✓ Fleet commonality with 737-800 reduces transition costs
✓ You serve U.S. transcontinental or longer regional routes
✓ Hot-and-high airport performance matters significantly
✓ Lower acquisition cost (list price) fits your budget constraints
✓ You prefer Boeing cockpit philosophy with more manual authority
Southwest, Ryanair, and United demonstrate the 737 MAX 8’s strengths in different markets.
The 737 MAX 8-200 variant (197 seats) offers unmatched per-seat economics for ultra-low-cost carriers.
Airlines making fleet decisions must consider total network requirements beyond pure fuel burn.
FAQs: A320neo vs 737 MAX Fuel Efficiency
Is the Airbus A320neo more fuel-efficient than the Boeing 737 MAX?
On a per-hour basis, yes—the A320neo burns approximately 2-4% less fuel (2,200-2,400 kg/hr vs 2,000-2,300 kg/hr for 737 MAX).
However, on a per-seat basis, the answer depends on configuration.
High-density 737 MAX 8-200s (197 seats) achieve better fuel per seat than typical A320neo configurations (150-180 seats).
For airlines flying similar configurations, the A320neo maintains a slight fuel efficiency advantage.
How much fuel does a Boeing 737 MAX burn per hour?
The 737 MAX 8 burns approximately 2,000-2,300 kg (4,400-5,100 lbs) per hour at cruise.
Actual consumption varies based on:
Aircraft weight and payload
Cruise altitude and speed
Weather conditions (headwinds/tailwinds)
Flight phase (initial climb burns more than mid-cruise)
On a typical 2-hour flight, expect total fuel consumption of 4,000-5,000 kg including taxi, climb, cruise, and descent.
Why does the A320neo engine have a larger fan diameter?
The A320neo’s LEAP-1A engine features a 78-inch fan versus the 737 MAX’s 69.4-inch fan.
Reason: Ground clearance constraints.
Airbus designed the A320 with taller landing gear, providing clearance for larger engines.
Boeing’s 737 design dates to the 1960s with low-slung engines, limiting fan diameter.
Larger fans enable higher bypass ratios, pushing more air around the engine core.
This improves propulsive efficiency and reduces fuel consumption.
The 69-inch limitation forced Boeing to mount engines higher and forward, creating the MCAS complications.
Do airlines report different fuel burn results?
Yes—real-world fuel burn varies significantly based on:
Configuration differences:
Ryanair’s 197-seat MAX 8-200: ~11.4 kg per seat per hour
Lufthansa’s 150-seat A320neo: ~15.0 kg per seat per hour
Operational factors:
Route length (longer sectors improve efficiency)
Load factors (fuller planes better utilize capacity)
Weather patterns (headwinds increase consumption)
Airline operating procedures (climb profiles, cruise speeds)
Maintenance standards:
Well-maintained aircraft with clean engines burn less fuel
Delayed engine washes increase consumption
Published manufacturer data represents ideal conditions; real operations always vary.
Which aircraft is cheaper to operate?
Total operating cost per seat depends on multiple factors beyond fuel:
737 MAX 8 advantages:
Lower maintenance costs (mature platform)
Slightly lower acquisition costs
Fleet commonality benefits for Boeing operators
A320neo advantages:
Better fuel efficiency per hour
Lower hourly fuel costs
Fleet commonality benefits for Airbus operators
On typical 1,500 nm routes with 165 seats, the aircraft achieve nearly identical seat-mile costs.
Configuration, route network, and existing fleet drive economic advantage more than aircraft type alone.
Airlines operating efficient fleets analyze total CASM (Cost per Available Seat Mile), not just fuel burn.
Conclusion: A Narrow Victory for Fuel Efficiency
The Airbus A320neo achieves marginally better fuel efficiency than the Boeing 737 MAX 8 on an absolute basis.
The A320neo’s advantages:
- 2-4% lower fuel consumption per hour at cruise
- Larger LEAP-1A fan diameter improves propulsive efficiency
- Sharklet winglets deliver 4% drag reduction
- Better performance on typical European/Asian sectors under 1,500 nm
The 737 MAX 8’s advantages:
- Lower fuel per seat in ultra-high-density configurations
- 4% range advantage enables longer routes
- Better hot-and-high performance
- Proven reliability and mature support infrastructure
The reality:
Both aircraft deliver exceptional efficiency—15-20% better than their predecessors.
The differences between them are marginal in real-world operations.
Airline configuration choices matter more than aircraft type.
A high-density 737 MAX 8-200 (197 seats) beats a premium-configured A320neo (150 seats) on per-passenger fuel burn.
Conversely, an A320neo in similar configuration achieves slightly better efficiency.
Fleet commonality drives decisions more than 2-3% fuel burn differences.
Southwest stays with Boeing; Wizz Air commits to Airbus—both achieve excellent economics.
For passengers, both aircraft offer quiet, comfortable experiences vastly superior to older narrowbodies.
For the environment, both represent significant progress toward sustainable aviation.
The “winner” depends entirely on each airline’s specific network, existing fleet, and operational priorities.