Airline size measures differently depending on the metric. Fleet count, revenue, destinations served—each tells a different story about competitive positioning and market reach.
Passenger volume reveals operational scale in ways other metrics cannot. How many people trust an airline to move them from point A to point B each year matters for understanding market dominance and network penetration across global aviation markets.
The largest airlines by passenger numbers aren’t always the most profitable or highest-revenue carriers. But they demonstrate something equally important: consistent demand and operational capacity to handle massive throughput across hundreds of airports and thousands of daily flights.
What Does “Largest Airline” Mean by Passenger Numbers?
Passenger count measures annual enplanements—individual passengers boarding aircraft. One person flying five times counts as five passengers in this metric, significantly different from measuring unique travelers.
This differs fundamentally from revenue measurements. Airlines carrying millions of short-haul passengers at low fares may rank higher by passenger volume than carriers operating fewer long-haul premium flights generating more profit per passenger.
Fleet size doesn’t directly correlate either. An airline with 300 aircraft flying domestic short-haul routes generates more annual passengers than a carrier with 250 widebody jets on international long-haul routes spanning multiple time zones.
Utilization matters more than inventory. Aircraft flying 12 hours daily on high-frequency routes move significantly more people than those flying 8 hours on long-distance journeys with extended ground times.
Passenger rankings reveal market positioning, network strategy, and operational philosophy more than financial health or service quality metrics.

Ranking: The World’s Largest Airlines by Annual Passengers
1. American Airlines (United States) — 215-220 Million Passengers
Business Model: Legacy network carrier
American Airlines operates the world’s largest airline network measured by passenger volume. The carrier’s massive domestic U.S. footprint drives these numbers—short-haul flights between major cities and extensive regional connections through American Eagle.
Fort Worth-based American maintains fortress hubs at Dallas/Fort Worth, Charlotte, Philadelphia, Phoenix, and Miami. This hub-and-spoke model concentrates traffic through central connection points, multiplying passenger counts as travelers connect between flights on their journey to final destinations.
The airline’s legacy carrier business model combines domestic frequency with international reach spanning six continents. Strong presence in Latin America and transatlantic markets supplements the domestic core, but short-haul U.S. routes generate the passenger volume that tops global rankings year after year.
2. Delta Air Lines (United States) — 190-200 Million Passengers
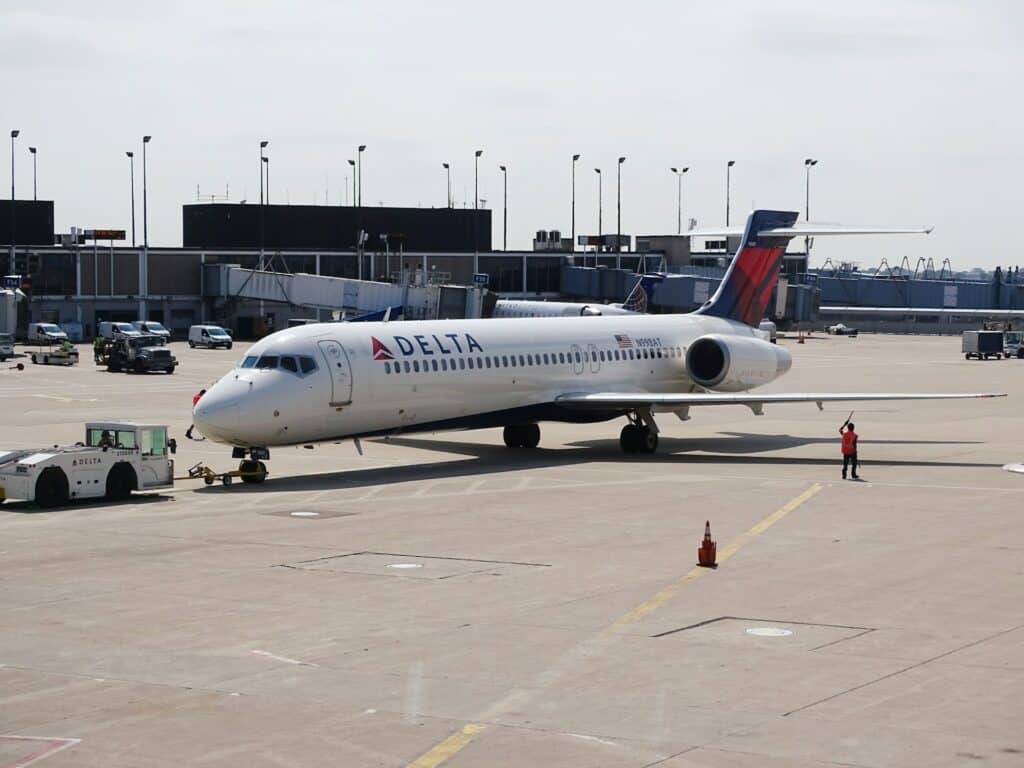
Business Model: Premium legacy carrier
Delta’s passenger volume reflects operational discipline and hub dominance that competitors struggle to replicate. Atlanta’s Hartsfield-Jackson—the world’s busiest airport—serves as Delta’s primary hub, processing millions of connecting passengers annually through strategically timed banks of flights.
The Atlanta-based carrier maintains significant hubs in Detroit, Minneapolis-St. Paul, Salt Lake City, and Seattle. This geographic distribution captures both business and leisure traffic across multiple U.S. regions, from northeastern business corridors to western leisure destinations.
Delta focuses on premium positioning while maintaining passenger volume through extensive domestic networks. The airline balances frequency-driven passenger counts with premium cabin revenue strategies that legacy competitors struggle to replicate profitably.
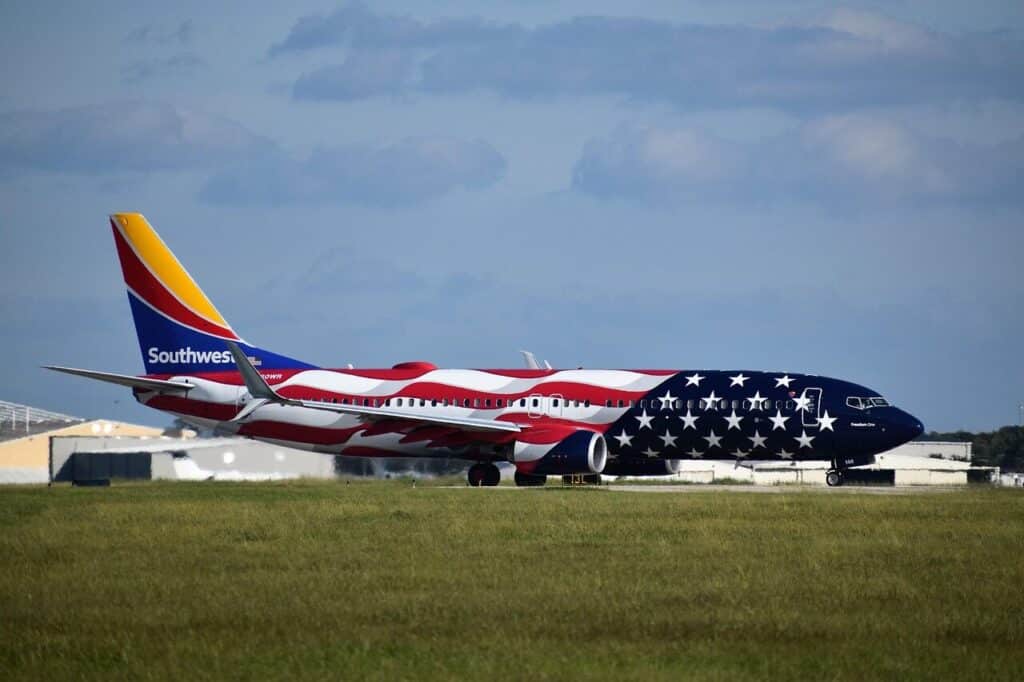
3. Southwest Airlines (United States) — 180-190 Million Passengers

Business Model: Low-cost carrier
Southwest’s point-to-point network strategy generates massive passenger volume without traditional hub-and-spoke complexity. The carrier operates more than 4,000 daily flights connecting U.S. cities directly, avoiding the connection delays that plague hub operations.
Low-cost carrier economics enable Southwest to offer frequent flights at competitive fares. High-frequency service on popular routes like Los Angeles-Las Vegas, Dallas-Houston, and Chicago-Denver multiplies daily passenger counts through sheer operational repetition.
All-Boeing 737 fleet simplicity supports rapid turnarounds and high aircraft utilization that competitors cannot match. Planes flying 11-12 hours daily instead of 8-9 hours generate proportionally more passenger movements per aircraft, amplifying total annual numbers dramatically.
4. United Airlines (United States) — 175-185 Million Passengers

Business Model: Legacy network carrier
United’s extensive domestic and international network positions the carrier among global passenger volume leaders. Chicago O’Hare, Denver, Houston, Newark, and San Francisco hubs create comprehensive U.S. coverage from coast to coast.
The airline combines high-frequency domestic operations with significant transpacific and transatlantic flying that extends global reach. United’s position as a Star Alliance founding member extends network reach through codeshare partnerships that boost passenger statistics significantly.
United’s domestic focus parallels other U.S. legacy carriers—short-haul flights between major metropolitan areas drive passenger counts even as long-haul international routes leverage advanced technology for operational efficiency.
5. Ryanair Group (Ireland) — 175-185 Million Passengers
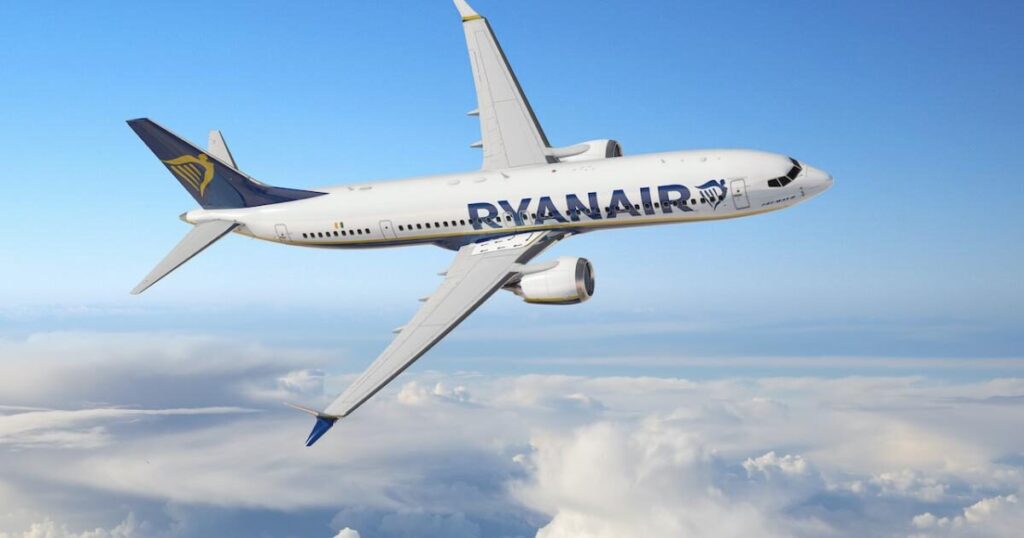
Business Model: Ultra-low-cost carrier
Ryanair operates Europe’s largest airline by passenger volume through ultra-low-cost carrier strategies that revolutionized European aviation. The Dublin-based carrier flies point-to-point routes across Europe, connecting secondary airports with rock-bottom fares.
High-frequency operations on short European routes generate extraordinary passenger throughput. A London-Dublin route might see 8-10 daily flights, each carrying 180+ passengers, creating massive daily passenger movements on single city-pairs that accumulate to enormous annual totals.
Ryanair’s business model prioritizes load factors and utilization over premium pricing strategies. All-Boeing 737 fleet enables 25-minute turnarounds, allowing aircraft to complete more flights daily than legacy competitors burdened by complex service requirements.
6. Turkish Airlines (Turkey) — 165-175 Million Passengers

Business Model: Full-service network carrier
Turkish Airlines leverages Istanbul’s strategic geographic position to connect Europe, Asia, Africa, and the Middle East through a single hub operation. The carrier operates one of the world’s most extensive international networks serving over 300 destinations.
Turkish combines domestic Turkish routes with massive international connectivity that generates substantial sixth-freedom traffic. Istanbul Airport serves as a hub where passengers flying between two countries connect through Turkey rather than flying direct routes.
The airline’s passenger volume reflects both origin-destination Turkey traffic and transit passengers connecting through Istanbul’s modern facilities. This hub strategy with new-generation aircraft multiplies passenger counts as travelers change planes during international journeys.
7. China Southern Airlines (China) — 155-165 Million Passengers

Business Model: State-owned legacy carrier
China Southern dominates domestic Chinese aviation with extensive networks connecting major cities and secondary markets across the world’s most populous nation. Guangzhou serves as the primary hub, with significant operations in Beijing and Chongqing.
China’s vast domestic market drives passenger volume growth that few global markets can match. Short-haul routes between Chinese cities operate with airline-like frequency, moving millions of passengers who would use high-speed rail or buses in geographically smaller countries.
The carrier operates both narrowbody aircraft for domestic short-haul and widebody jets for international long-haul. But domestic flying—particularly on routes under 1,000 miles—generates the bulk of annual passenger statistics that drive global ranking position.
8. China Eastern Airlines (China) — 150-160 Million Passengers
Business Model: State-owned legacy carrier
China Eastern’s Shanghai hub positions the airline as a major player in both domestic Chinese and international Asian markets. The carrier operates extensive networks throughout mainland China connecting first-tier and secondary cities with multiple daily frequencies.
Domestic passenger volume dominates China Eastern’s statistics in ways international observers often underestimate. Routes between Shanghai, Beijing, Guangzhou, Shenzhen, and dozens of regional Chinese cities operate multiple daily flights on narrowbody aircraft configured for maximum passenger capacity.
Partnership with Air France-KLM and SkyTeam alliance membership extends international reach beyond owned networks. But the domestic Chinese market provides the passenger volume that ranks China Eastern among global leaders in annual throughput.
9. IndiGo (India) — 100-110 Million Passengers
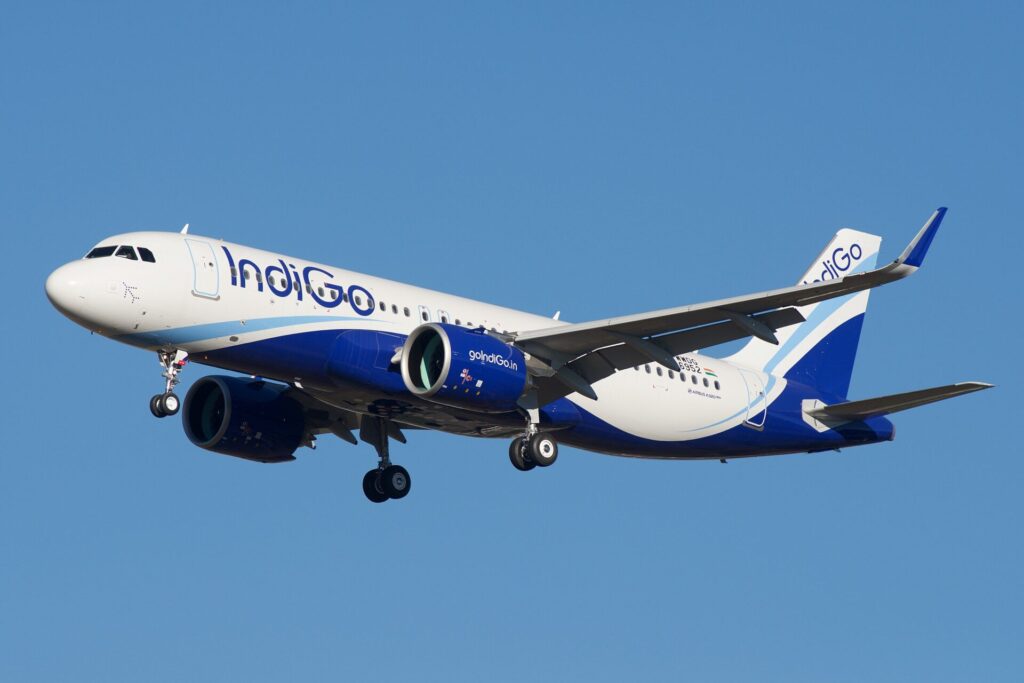
Business Model: Low-cost carrier
IndiGo dominates India’s rapidly growing domestic aviation market, carrying more passengers than all other Indian carriers combined through aggressive network expansion. The airline operates a point-to-point network connecting major Indian cities with secondary markets.
Fleet standardization around Airbus A320 family aircraft creates operational efficiencies that support low-cost operations at scale unmatched by competitors. The carrier operates over 2,000 daily flights serving approximately 85 destinations across India and international markets in Asia and the Middle East.
India’s domestic aviation growth rate exceeds most global markets, providing tailwinds for passenger volume expansion. IndiGo’s market share approaching 60% of domestic traffic positions the carrier as the dominant force in one of the world’s fastest-growing aviation markets with enormous future potential.
10. Air China (China) — 95-105 Million Passengers

Business Model: State-owned flag carrier
Air China’s Beijing hub positions the carrier as China’s flag carrier with strong government and business travel focus reflecting the capital city’s political importance. The airline emphasizes premium services alongside mass-market domestic operations.
Extensive domestic Chinese network provides passenger volume foundation across the world’s second-largest economy. Routes connecting Beijing with provincial capitals and major business centers operate multiple daily frequencies carrying businesspeople and leisure travelers.
International operations to North America, Europe, and across Asia supplement domestic core operations. But like other Chinese carriers, short-haul domestic flying generates the majority of annual passenger statistics that drive global ranking position among the world’s largest airlines.
11. LATAM Airlines Group (Chile/Brazil) — 90-100 Million Passengers

Business Model: Network carrier
LATAM Airlines Group operates the largest airline network in Latin America, formed through the merger of Chile’s LAN Airlines and Brazil’s TAM Airlines. The carrier dominates South American connectivity through hubs in São Paulo, Santiago, Lima, and other regional centers.
Geographic coverage spanning South America’s vast distances generates passenger volumes through both domestic markets and international connections across the continent. The airline serves over 140 destinations across South America, North America, Europe, and Oceania.
Brazil’s domestic market size provides substantial passenger volume, while regional routes connecting South American countries create additional traffic. The carrier’s oneworld alliance membership extends global connectivity beyond owned South American networks through codeshare partnerships.
12. easyJet (United Kingdom) — 90-95 Million Passengers

Business Model: Low-cost carrier
easyJet’s low-cost carrier model focuses on short-haul European routes from UK and continental bases serving both business and leisure travelers. All-Airbus A320 family fleet operations emphasize efficiency and high utilization across the network.
The carrier serves major European cities from bases in London, Milan, Geneva, and Berlin. Point-to-point flying on routes averaging 1-2 hours enables multiple daily flights per aircraft that multiply passenger throughput beyond what hub operations achieve.
Leisure-focused network targets vacation destinations alongside business routes connecting major European cities. easyJet’s passenger volume reflects consistent European short-haul demand and the carrier’s ability to fill planes at competitive fares even as environmental costs rise.
13. International Airlines Group (UK/Spain) — 85-95 Million Passengers

Business Model: Airline holding company
International Airlines Group operates multiple airline brands including British Airways, Iberia, Aer Lingus, Vueling, and LEVEL. Combined passenger volumes across these carriers position IAG among the world’s largest airline groups through portfolio strategy.
Each brand targets different market segments: British Airways focuses on premium long-haul, Iberia connects Europe and Latin America, Vueling dominates Spanish short-haul markets, and Aer Lingus serves transatlantic routes from Ireland. This approach maximizes total passenger volumes.
Shared services and coordinated networks create operational synergies while maintaining distinct brand identities that appeal to diverse customer segments. The group operates over 570 aircraft serving approximately 270 destinations across more than 90 countries with differentiated service offerings.
14. Lufthansa Group (Germany) — 85-95 Million Passengers

Business Model: Airline holding company
Lufthansa Group operates multiple carriers including Lufthansa German Airlines, Swiss International Air Lines, Austrian Airlines, Brussels Airlines, and Eurowings. Combined passenger volumes position the group among Europe’s largest airline operations.
Frankfurt and Munich hubs anchor the network, connecting European cities to long-haul destinations across Asia, North America, Africa, and South America. The group operates approximately 700 aircraft serving over 200 destinations worldwide with premium service standards.
Premium positioning of mainline brands generates higher per-passenger revenue while Eurowings captures low-cost carrier market segments. This dual-brand strategy balances passenger volume growth with yield optimization across different traveler demographics.
15. Air France-KLM (France/Netherlands) — 80-90 Million Passengers

Business Model: Airline holding company
Air France-KLM operates Europe’s leading airline group combining French and Dutch carriers with complementary networks. The merger created operational synergies while maintaining separate brand identities that appeal to different markets.
Paris Charles de Gaulle and Amsterdam Schiphol serve as primary hubs connecting Europe with global destinations. SkyTeam alliance leadership extends network reach through partnerships that supplement owned capacity with codeshare connections.
The group balances premium long-haul operations with short-haul European networks feeding international flights. Fleet modernization programs improve fuel efficiency and passenger experience while maintaining competitive cost structures across diverse route networks.
16. United Airlines – International Operations (United States) — 70-80 Million Passengers

Business Model: Legacy carrier international division
United’s international operations represent a substantial standalone operation within the larger airline structure. Transpacific routes from West Coast hubs to Asia carry millions of passengers annually on widebody aircraft.
Hub positioning in San Francisco, Los Angeles, and Honolulu creates strategic gateways for Asian connectivity. Business travel demand between U.S. and Asian markets drives premium cabin utilization that generates revenue exceeding passenger count contributions.
Partnership networks through Star Alliance extend reach beyond owned operations. Joint ventures with international carriers create coordinated schedules and shared capacity that benefits passengers while optimizing aircraft utilization across the Pacific.
17. Air Canada (Canada) — 55-65 Million Passengers
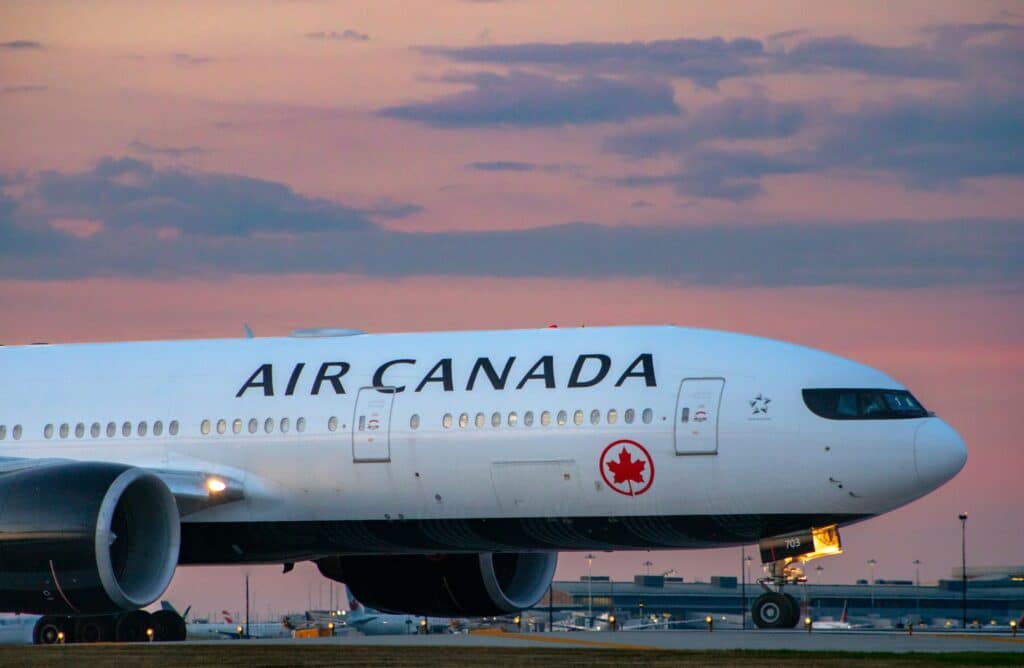
Business Model: Flag carrier network airline
Air Canada operates Canada’s largest airline with dominant market share across Canadian domestic and transborder routes to the United States. Toronto and Vancouver hubs anchor the network serving international destinations.
Geographic monopoly in many Canadian markets provides pricing power and load factor advantages that smaller competitors cannot match. Limited domestic competition allows Air Canada to maintain frequencies that drive passenger volume across Canada’s vast distances.
The airline operates diversified fleet spanning narrowbody domestic aircraft to widebody international jets. Star Alliance membership provides global connectivity that supplements owned operations with partner connections on six continents.
18. Avianca Group (Colombia) — 50-60 Million Passengers
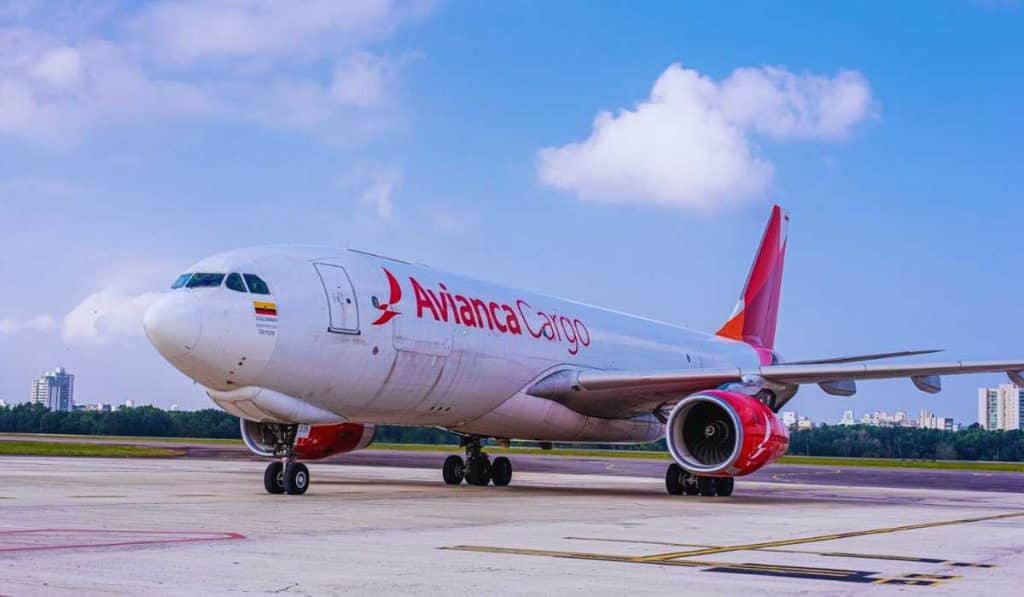
Business Model: Latin American network carrier
Avianca operates Colombia’s flag carrier with extensive networks throughout Central and South America. The airline’s strategic position in Colombia provides access to growing Latin American markets with increasing air travel penetration.
Hub operations in Bogotá connect South American cities with Central America, the Caribbean, and North America. Star Alliance membership extends network reach through partnerships that supplement Avianca’s owned South American capacity.
The airline balances domestic Colombian routes with international connectivity across the Americas. Fleet modernization with fuel-efficient narrowbody and widebody aircraft supports network expansion while managing operating costs in competitive markets.
19. Cathay Pacific (Hong Kong) — 45-55 Million Passengers

Business Model: Premium international carrier
Cathay Pacific operates from Hong Kong’s strategic position as an Asian aviation hub connecting China with global destinations. The carrier focuses on premium long-haul services rather than volume-driven strategies.
International network spans Asia, Europe, North America, and Oceania with emphasis on business travel markets. Premium positioning generates higher revenue per passenger than volume-focused competitors achieve with dense seating configurations.
The airline’s passenger volume reflects quality over quantity strategy—fewer passengers at higher yields generates comparable profitability to carriers moving millions more passengers on short-haul routes at lower margins.
20. Alaska Airlines (United States) — 48-52 Million Passengers

Business Model: Regional network carrier
Alaska Airlines operates the largest passenger network along the U.S. West Coast, with primary hubs in Seattle, Portland, Los Angeles, and San Francisco. The carrier’s acquisition of Virgin America expanded Southern California operations and transcontinental route coverage.
West Coast dominance creates geographic concentration that supports high-frequency operations on key routes connecting major cities. The airline serves approximately 120 destinations across the United States, Canada, Mexico, and Costa Rica with a fleet of approximately 340 aircraft.
Premium service positioning differentiates Alaska from ultra-low-cost competitors while maintaining competitive pricing on leisure routes. This hybrid approach balances passenger volume growth with yield management across diverse West Coast markets from Alaska to Mexico.
Why U.S. Airlines Dominate Passenger Rankings
Four of the five largest airlines by passenger volume operate from the United States. Geography, economics, and network strategies explain this structural dominance.
The domestic U.S. market spans 3,000 miles coast-to-coast with 330 million people and strong business travel demand that generates consistent airline passenger volumes. Distance makes flying economically competitive with driving or rail, unlike Europe where high-speed trains capture many travelers.
High flight frequency on popular routes multiplies passenger counts dramatically. Los Angeles to San Francisco might see 40+ daily flights from multiple carriers. Each flight carries 150-180 passengers, generating thousands of daily passenger movements on a single city-pair.
U.S. airlines operate hub-and-spoke networks that concentrate traffic through major airports. A passenger flying Omaha to Orlando likely connects through Denver, Chicago, or Atlanta—counting as two flight segments and two passenger enplanements that multiply total statistics.
Strong domestic focus contrasts with international-heavy carriers. American, Delta, Southwest, and United derive 70-80% of revenue from domestic operations, where short-haul flying generates more passenger movements per aircraft than long-haul international routes requiring extended ground times.
Legacy carrier consolidation reduced U.S. competition but concentrated passenger volume among remaining carriers. Post-merger American (combining US Airways), United (combining Continental), and Southwest (absorbing AirTran) each operate massive networks that would rank as multiple airlines if split into component parts.
Low-Cost Airlines vs Legacy Airlines: Passenger Volume Comparison
Low-cost carriers move extraordinary passenger volumes despite generating lower total revenue than legacy airlines. Ryanair, Southwest, and easyJet each rank among global top 15 measured by passengers.
Frequency drives passenger counts for budget carriers more than any other factor. Operating 10 daily flights on a route instead of 3 triples passenger volume even if load factors match. Low-cost carriers optimize schedules for aircraft utilization, not passenger convenience.
Point-to-point networks avoid hub complexity but generate substantial throughput. Southwest operates 4,000+ daily flights connecting U.S. cities directly. Each flight adds passenger count separately without requiring connections that delay travel times.
High load factors—typically 85-90% for successful low-cost carriers—maximize passengers per flight. Legacy carriers at 80-85% load factors leave more empty seats, reducing annual passenger totals per aircraft while maintaining revenue flexibility.
Short average flight length multiplies daily movements exponentially. An aircraft flying six 90-minute segments daily moves more passengers than one flying two 6-hour segments, even covering similar total miles through the air.
Profitability doesn’t correlate directly with passenger volume across the industry. Low-cost carriers move millions at thin margins while legacy airlines generate higher revenue from fewer premium passengers. Business strategy determines whether maximizing passenger count or revenue per passenger matters more for competitive success.
Why Some Famous Airlines Don’t Appear at the Top
Emirates, Qatar Airways, Singapore Airlines, and other internationally prominent carriers don’t rank among passenger volume leaders despite stellar reputations and financial performance.
Long-haul international focus limits total passenger counts structurally. A Dubai-Los Angeles flight on Airbus A380 carries 500 passengers maximum. The same aircraft on 12-hour turnaround can complete one round trip daily, generating 1,000 daily passengers.
Compare that to Southwest operating Boeing 737 on 90-minute turns completing 7-8 flights daily carrying 175 passengers each—1,200-1,400 daily passengers per aircraft. Short-haul operations multiply passenger throughput dramatically beyond what long-haul flying can achieve.
International carriers lack domestic market scale that U.S. and Chinese airlines exploit. Qatar Airways operates from Doha—a city of 2.5 million. American Airlines serves a domestic U.S. market of 330 million. Origin-destination traffic volume differs by orders of magnitude.
Premium positioning intentionally limits volume for quality and revenue reasons. Singapore Airlines and Emirates focus on business and first-class cabins that reduce total seat count but increase revenue per passenger dramatically. Three-class widebody configuration carries 350 passengers vs 400+ high-density layout.
Hub reliance on sixth-freedom traffic creates single-connection passengers rather than point-to-point volume. Emirates passengers often connect through Dubai rather than originating there, meaning one passenger journey equals two enplanements spread across Emirates and a partner carrier’s network.
How Airline Passenger Rankings Change Over Time
Passenger volume rankings shift gradually as airlines expand networks, adjust capacity, and respond to demand changes. But sudden disruptions occasionally reshape the landscape dramatically.
Pandemic impact demonstrated ranking volatility when global airline passenger traffic collapsed 60% in 2020. International routes suffered more than domestic, causing airlines with strong domestic networks (U.S. carriers, Chinese airlines, Ryanair) to recover faster than international-focused carriers.
Aircraft delivery delays constrain growth for some carriers. Boeing 737 MAX groundings and production issues, plus Airbus A320neo delivery bottlenecks, prevent airlines from deploying new capacity even when demand exists and bookings remain strong.
Chinese carriers may climb rankings as domestic Chinese aviation continues expanding at rates exceeding Western markets. Rising middle-class income and geographic size support passenger growth trajectories. China Southern, China Eastern, and Air China could add 50+ million annual passengers each over the next decade.
Indian carriers represent emerging competition in global rankings. IndiGo already operates 300+ Airbus A320 family aircraft with orders for hundreds more. India’s population and economic growth trajectory support massive domestic aviation expansion that could reshape global passenger rankings significantly.
Consolidation occasionally creates new leaders instantly. American Airlines absorbed US Airways, United merged with Continental, and Alaska acquired Virgin America. Future mergers could instantly vault combined entities up passenger rankings while reducing competitive options for travelers.
Conclusion: Passenger Volume Doesn’t Tell the Whole Story
Airlines carrying the most passengers aren’t necessarily the most successful airlines by financial or strategic measures. Passenger volume measures operational scale and network reach, not financial performance or service quality excellence.
Southwest moves 195 million passengers annually and generates consistent profits through operational efficiency. Emirates carries 80 million and posts comparable profitability with higher revenue per passenger. Different business models optimize different metrics for competitive advantage.
Low-cost carriers dominate rankings through frequency and utilization that legacy carriers cannot match profitably. Legacy carriers focus on premium revenue from smaller passenger bases. Regional carriers move millions on short-haul networks. Long-haul international operators prioritize yield over volume.
Understanding airline size requires examining multiple dimensions: passenger counts, revenue, profit margins, fleet size, network breadth, and market position. Passenger statistics reveal one facet of a complex industry where strategy determines whether moving millions matters more than maximizing revenue per traveler.
The largest airlines by passengers succeeded by aligning operational capacity with market demand. Whether through U.S. domestic frequency, European low-cost point-to-point networks, or Chinese domestic expansion, these carriers built systems that consistently fill aircraft and generate throughput at scales competitors cannot match economically.