Market capitalization reveals which airlines investors trust most in 2025. As global aviation continues its post-pandemic recovery, market cap rankings show not just operational size, but financial confidence, competitive positioning, and long-term growth potential in an industry historically marked by volatility.
The airline sector’s market capitalization reflects complex factors, including fuel efficiency, loyalty program valuations, fleet modernization strategies, and geographic market exposure. Unlike revenue or passenger metrics, market cap captures investor sentiment about future profitability across economic cycles.
US carriers dominate the top rankings through industry consolidation, massive domestic markets, and highly profitable loyalty programs. European low-cost carriers and Asian growth markets challenge traditional business models with operational efficiency and exposure to emerging aviation demand.
What Is Market Capitalization and Why Does It Matter in Aviation
Market capitalization represents the total market value of a publicly traded company’s outstanding shares. For airlines, this metric provides a real-time assessment of what investors believe the company is worth based on future cash flow generation and returns.
Market Cap Formula: Share Price × Total Outstanding Shares
Airlines experience greater market cap volatility than most sectors due to fuel price exposure, which represents 20-30% of operating costs. A $10 per barrel oil price change can swing annual profitability by hundreds of millions of dollars.
Key Aviation Metrics Influencing Valuation
Available Seat Miles (ASM) measures total passenger capacity while Revenue Passenger Kilometers (RPK) tracks actual demand. The relationship between these metrics—expressed as load factor—significantly impacts profitability and valuation.
Cost per Available Seat Mile (CASM) and Revenue per Available Seat Mile (RASM) provide critical efficiency comparisons. Low-cost carriers target CASM below 8 cents while legacy carriers operate at 12-15 cents, reflecting different business model economics.
Airlines maintaining 80%+ load factors while commanding premium yields earn substantially higher market caps than competitors struggling with seat-filling at profitable prices. Fleet age and composition directly drive valuations as newer aircraft like Boeing 737 MAX and Airbus A320neo family reduce operating costs while improving passenger experience.
Current Ranking – Largest Airlines by Market Cap (2025)
Global Airline Market Cap Rankings
| Rank | Airline | Market Cap (INR Trillion) | Country | 1-Year Change |
|---|---|---|---|---|
| #612 | Delta Air Lines | ₹3.240 T | United States | -4.44% |
| #696 | Ryanair | ₹2.833 T | Ireland | +38.5% |
| #767 | United Airlines Holdings | ₹2.584 T | United States | -8.06% |
| #868 | IndiGo (InterGlobe Aviation) | ₹2.259 T | India | +24.3% |
| #873 | IAG (British Airways, Iberia) | ₹2.251 T | Spain | +40.32% |
| #1033 | Air China | ₹1.838 T | China | +10.51% |
| #1270 | Southwest Airlines | ₹1.451 T | United States | -17.14% |
| #1286 | China Eastern Airlines | ₹1.426 T | China | +46.82% |
| #1330 | Singapore Airlines | ₹1.372 T | Singapore | +13.15% |
Source: CompaniesMarketCap.com, November 2025 data
#1. Delta Air Lines (DAL) – #612 Globally
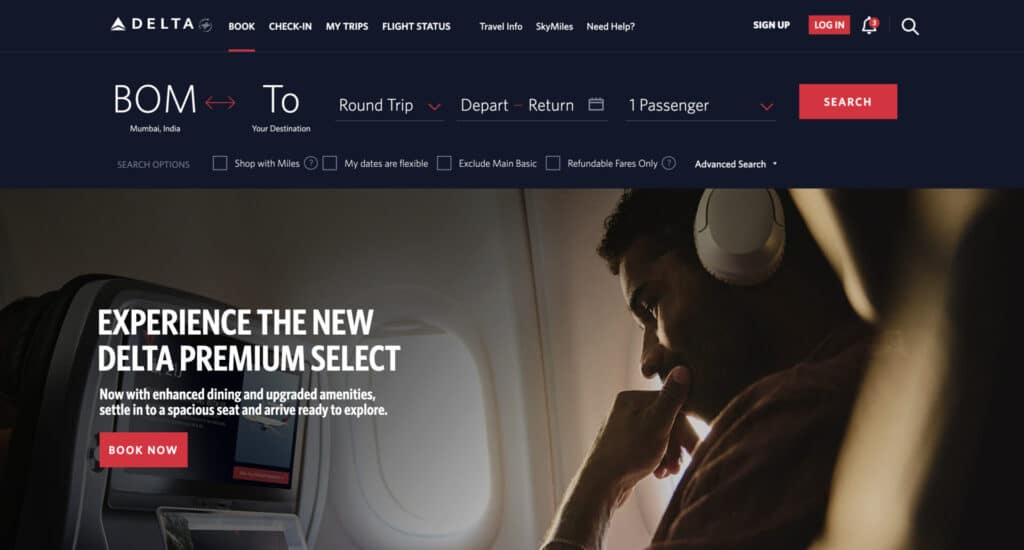
Market Cap: ₹3.240 Trillion ($39 billion USD)
Business Model: Full-Service Network Carrier
Hub Airports: Atlanta (ATL), Minneapolis (MSP), Detroit (DTW), Salt Lake City (SLC)
Delta operates approximately 900 aircraft serving 300+ destinations worldwide. The carrier’s competitive advantage stems from operational reliability consistently ranking #1 among US carriers, premium cabin products commanding yield premiums, and the highly valued SkyMiles loyalty program.
Fleet Composition: Airbus A220, A321neo, A330, A350; Boeing 737-900ER, 757, 767, 777
Key Revenue Drivers: Premium transcontinental services, corporate travel contracts, SkyMiles program generating $5+ billion annually with 50%+ margins, technical operations serving third-party customers
Strategic Strengths: Vertically integrated business, including refinery ownership providing fuel cost hedging, technology investments in customer experience and operational efficiency, Seattle hub providing Asia-Pacific connectivity
Risk Factors: Significant debt from fleet modernization programs, international market exposure to geopolitical volatility, competition from ultra-low-cost carriers on domestic routes
Delta’s 2024-2025 market cap declined 4.44% reflecting broader airline sector pressures including pilot labor costs and economic uncertainty impacting premium travel demand.
#2. Ryanair (RYAAY) – #696 Globally

Market Cap: ₹2.833 Trillion ($34 billion USD)
Business Model: Ultra-Low-Cost Carrier
Hub Airports: Dublin (DUB), London Stansted (STN), Milan Bergamo (BGY), plus 80+ bases
Ryanair operates as Europe’s largest airline by passenger count with 500+ aircraft serving 200+ destinations across Europe and North Africa. The carrier’s ultra-low-cost model delivers industry-leading profit margins exceeding 20% despite offering Europe’s lowest base fares.
Fleet Composition: All-Boeing 737 fleet (737-800, 737 MAX 8-200 “Gamechanger”)
Key Revenue Drivers: Ancillary revenues representing 30%+ of total revenue including baggage fees, seat selection, priority boarding, onboard sales, car rentals, hotels; aircraft utilization exceeding 11 hours daily; secondary airport agreements providing low airport costs
Strategic Strengths: Europe’s youngest fleet with average age under 7 years, bulk aircraft purchase agreements with Boeing providing 30-40% cost advantages versus competitors, point-to-point route network eliminating hub complexity
Risk Factors: Regulatory scrutiny of fee structures and passenger rights compliance, labor relations challenges across 30+ European countries, Brexit impacts on UK-EU flying rights, competition from emerging ultra-low-cost rivals
Ryanair’s 38.5% market cap growth through 2025 significantly outperformed legacy European carriers as investors rewarded operational efficiency and market share gains. Visit Ryanair’s investor relations for detailed financial reports.
#3. United Airlines Holdings (UAL) – #767 Globally
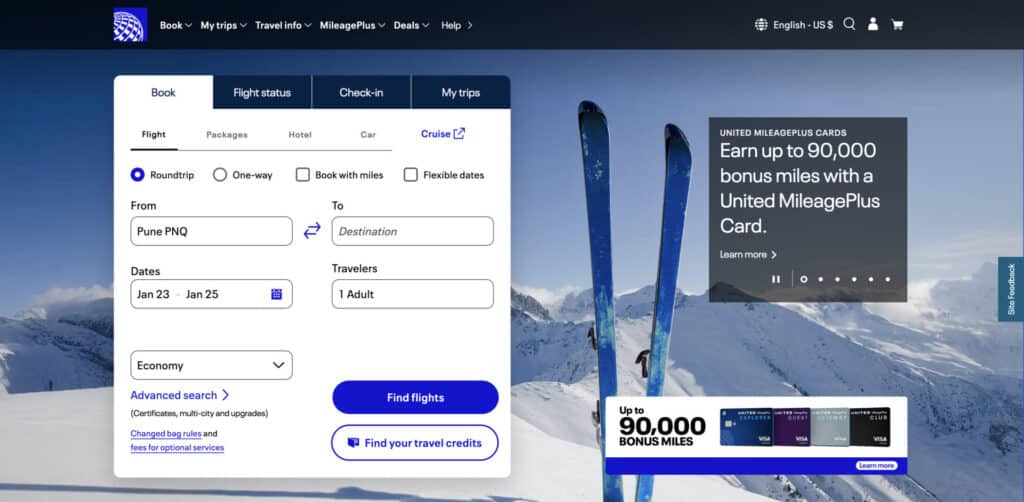
Market Cap: ₹2.584 Trillion ($31 billion USD)
Business Model: Full-Service Network Carrier
Hub Airports: Chicago O’Hare (ORD), Denver (DEN), Houston (IAH), Los Angeles (LAX), Newark (EWR), San Francisco (SFO), Washington Dulles (IAD)
United operates extensive international route networks, particularly to Asia-Pacific and Europe, positioning it as America’s leading transoceanic carrier. The airline’s fleet renewal focusing on Boeing 737 MAX and 787 Dreamliner aircraft reduces CASM while improving customer experience.
Fleet Composition: Airbus A319, A320; Boeing 737-700/800/900/MAX, 757, 767, 777, 787 Dreamliner
Key Revenue Drivers: Premium transcontinental services including Polaris business class, cargo operations generating substantial ancillary revenue, MileagePlus loyalty program valued independently at $20+ billion
Strategic Strengths: Seven major hubs providing geographic diversity and network connectivity, substantial widebody fleet enabling long-haul flying, Star Alliance membership providing global partnerships
Risk Factors: Hub concentration in weather-disrupted markets including Newark and Chicago, pilot contract negotiations pressuring labor costs, Boeing aircraft delivery delays constraining growth plans
United’s 8.06% market cap decline from 2024 reflects investor concerns about capacity growth constraints and margin pressure from labor cost inflation.
#4. IndiGo (InterGlobe Aviation) – #868 Globally

Market Cap: ₹2.259 Trillion ($27 billion USD)
Business Model: Low-Cost Carrier
Hub Airports: Delhi (DEL), Mumbai (BOM), Bangalore (BLR)
IndiGo commands over 60% of India’s domestic market through operational punctuality, cost discipline, and network density. The airline operates an all-Airbus fleet across 100+ domestic and international destinations.
Fleet Composition: All-Airbus A320 family (A320ceo, A320neo, A321neo) with 500+ aircraft on order
Key Revenue Drivers: India’s rapidly growing middle class, insufficient railway infrastructure creating domestic flying demand, international expansion to Southeast Asia and Middle East, ancillary revenue from baggage, meals, seat selection
Strategic Strengths: Dominant market position creating economies of scale, youngest fleet in India with average age under 4 years, operational reliability leading the industry with 80%+ on-time performance, Airbus order book providing fleet growth through 2035
Risk Factors: Intense domestic price competition, airport infrastructure constraints at major hubs, rupee currency fluctuations affecting dollar-denominated aircraft leases
IndiGo’s 24.3% market cap growth reflects investor confidence in India’s aviation trajectory as the country moves toward becoming the world’s third-largest market by 2030.
For more insights on Indian aviation, explore our coverage on aviation schools.
#5. International Airlines Group (IAG) – #873 Globally
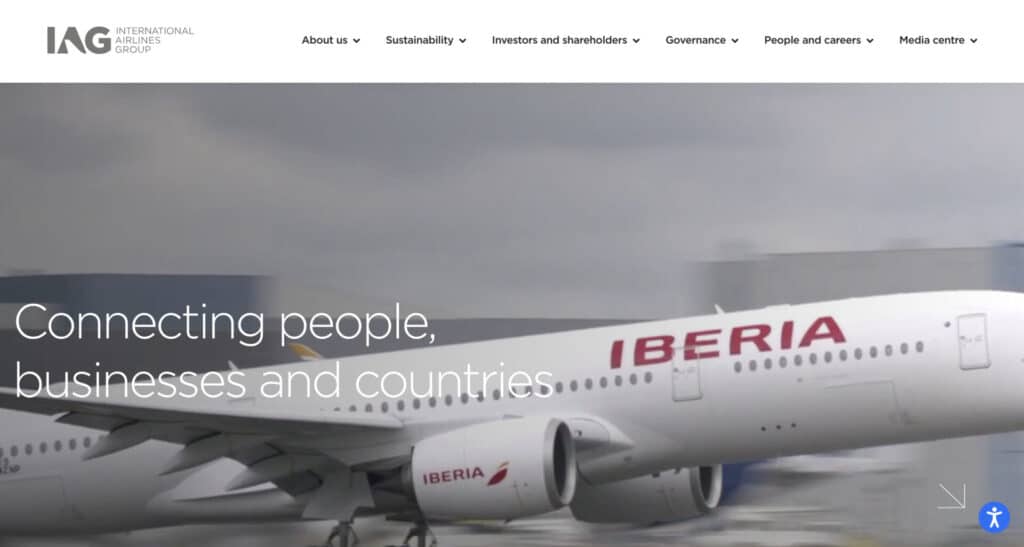
Market Cap: ₹2.251 Trillion ($27 billion USD)
Business Model: Multi-Brand Holding Company
Airlines: British Airways, Iberia, Vueling, Aer Lingus, LEVEL
IAG‘s multi-brand strategy targets different market segments from ultra-low-cost (LEVEL) to premium full-service (British Airways). The group operates major hubs at London Heathrow, Madrid, Barcelona, and Dublin providing extensive transatlantic connectivity.
Combined Fleet: 570+ aircraft including Airbus A320 family, A330, A350; Boeing 777, 787
Key Revenue Drivers: Premium transatlantic business travel, London Heathrow slot portfolio valued at billions, cargo operations, Avios loyalty program monetization across brands
Strategic Strengths: Slot holdings at capacity-constrained European airports providing competitive moats, diversified brand portfolio capturing multiple market segments, consolidation synergies generating cost savings
Risk Factors: UK-EU aviation agreement uncertainties post-Brexit, labor relations complexity across multiple jurisdictions and unions, competition from Gulf carriers on long-haul routes
IAG’s 40.32% market cap surge through 2025 reflects pandemic recovery acceleration and transatlantic business travel resumption.
Additional Top 10 Airlines
Air China (601111.SS) maintains ₹1.838 trillion market cap as China’s flag carrier operating major hubs in Beijing, Chengdu, and Shanghai. Government support and preferential slot allocations provide competitive advantages.
Southwest Airlines (LUV) holds ₹1.451 trillion market cap despite 17.14% decline reflecting investor concerns about Boeing 737 MAX delivery delays constraining growth and pressure from ultra-low-cost competition.
China Eastern Airlines (600115.SS) achieved 46.82% growth to ₹1.426 trillion as Chinese domestic aviation recovered and international routes reopened following COVID restrictions.
Singapore Airlines (C6L.SI) maintains ₹1.372 trillion valuation through premium service quality, young fleet averaging under 6 years, and strategic Singapore hub position. Explore private jet services in Singapore for related aviation options.
Why US Carriers Dominate Global Market Cap Rankings
Structural Advantages Creating Valuation Premiums
United States carriers hold five of the top ten positions in global airline market cap rankings through structural advantages international competitors struggle to replicate.
Domestic Market Scale: The US aviation market generates $250+ billion annual revenue from 800+ million passengers, providing revenue stability unavailable to airlines dependent on international operations or smaller domestic markets.
Industry Consolidation: Mergers creating American Airlines, United Airlines, Delta Air Lines, and Southwest’s acquisition of AirTran reduced destructive capacity competition. Four network carriers now control 80% of US domestic capacity, enabling rational pricing.
Ancillary Revenue Leadership
US carriers generate $50+ ancillary revenue per passenger versus $20-30 for European and Asian competitors. Baggage fees, seat selection charges, premium cabin upsells, and change fees significantly improve unit revenues without corresponding cost increases.
Loyalty Program Valuations
Delta SkyMiles, United MileagePlus, and American AAdvantage operate as standalone businesses worth tens of billions. These programs generate revenue from credit card partnerships, airline mile sales to partners, and transactions extending beyond flying.
Delta’s SkyMiles contributes $5+ billion annual revenue with margins exceeding 50%. Investors value these programs using retail or financial services multiples rather than airline metrics, creating substantial valuation premiums.
Regulatory Environment: US airlines operate with limited government ownership, providing management flexibility for restructuring, capacity adjustments, and strategic pivots unavailable to state-owned international competitors.
Learn more about aviation financing options available to different carrier types.
Fastest-Growing Airlines by Market Value (2025)
Market Cap Growth Leaders
| Airline | Market Cap Growth (2024-2025) | Key Growth Drivers |
|---|---|---|
| China Eastern Airlines | +46.82% | Chinese domestic recovery, international route reopening |
| IAG | +40.32% | Transatlantic business travel resumption, multi-brand strategy |
| Ryanair | +38.5% | European market share gains, ultra-low-cost model efficiency |
| IndiGo | +24.3% | India aviation market expansion, 60%+ domestic market share |
| Singapore Airlines | +13.15% | Premium service quality, strategic hub positioning |
| Air China | +10.51% | Government support, preferential slot allocations |
Why These Airlines Outperform
Growth carriers share common characteristics including exposure to high-growth geographic markets, low-cost business models or premium positioning commanding yield premiums, modern fuel-efficient fleets, and strong competitive positions within core markets.
China Eastern benefits from Chinese domestic aviation recovery and international route reopening. Government support for state-owned carriers provides financial stability while China’s expanding middle class creates leisure and outbound international demand.
Ryanair continues European market share gains as travelers increasingly choose lowest-fare options. The carrier’s Boeing 737 order book, secondary airport strategies, and ancillary revenue generation create profit margins double European legacy levels.
IndiGo captures India’s aviation growth as per-capita flying rates increase toward developed market levels. The carrier’s operational excellence and Airbus order book exceeding 500 aircraft provide decade-long growth capacity.
Low-cost carriers consistently outperform legacy competitors in market cap growth, reflecting investor preference for business models generating higher returns on invested capital with less cyclical volatility.
Factors Influencing Airline Market Capitalization
Financial Performance Metrics
Revenue Quality: Airlines generating revenue from diversified sources including premium cabins, cargo, loyalty programs, and ancillary services command higher valuations than carriers dependent solely on economy ticket sales.
Operating Margin: Legacy carriers historically operated on 5-8% margins while low-cost carriers achieved 15-20%, creating substantial valuation disparities.
EBITDAR (Earnings Before Interest, Taxes, Depreciation, Amortization, Rent) measures profitability before capital structure impacts, providing useful comparisons across carriers with different fleet ownership strategies.
Operational Efficiency Drivers
Fuel Costs: Airlines’ largest variable expense with movements of cents per gallon impacting annual profitability by hundreds of millions. Low-cost carriers operating fuel-efficient narrowbodies on short-haul routes face lower per-passenger fuel exposure.
Load Factor & Yield: Airlines consistently achieving 80%+ load factors generate higher margins, but load factor must be evaluated alongside yield (average revenue per passenger mile). Filling planes with unprofitable passengers destroys value.
CASM vs RASM Spread: Low-cost carriers target CASM below 8 cents while legacy carriers operate at 12-15 cents. RASM varies by network with premium-positioned carriers achieving 15+ cents versus low-cost carriers at 10-12 cents. The RASM-CASM spread determines profitability.
Macroeconomic Influences
GDP Growth: Historically generates 1.5-2x aviation demand growth, though this relationship varies by market maturity. Developed markets show lower elasticity while emerging markets demonstrate higher multiples.
Exchange Rates: International airlines earning dollars or euros while facing local currency costs benefit from strong dollar environments. Carriers earning revenue in weak currencies while paying dollar-denominated aircraft leases face margin pressure.
Geopolitical Events: Conflicts disrupting routes, trade disputes affecting business travel, and airspace closures create valuation volatility.
Industry-Specific Factors
Aircraft Delivery Delays: Boeing and Airbus manufacturing issues constrain airline growth while providing pricing power to carriers with existing capacity. The Boeing 737 MAX grounding dramatically impacted growth strategies, particularly for Southwest Airlines.
IATA Regulations: Governing safety, security, and operational standards create baseline costs all carriers must meet. According to IATA’s latest reports, global aviation demand continues recovering toward pre-pandemic levels.
Bilateral Agreements: Governing international flying rights determine route access and competitive dynamics. Open Skies agreements benefit consumers while creating intense competition for incumbent carriers.
For comprehensive aviation industry analysis, visit aviation consulting services specializing in market intelligence.
Market Cap vs Fleet Size vs Passengers: Key Differences
Valuation Per Aircraft Analysis
Airlines with highest market cap don’t always operate largest fleets or serve most passengers, revealing how investors value different business models.
| Airline | Aircraft | Annual Passengers | Market Cap | Value per Aircraft |
|---|---|---|---|---|
| Ryanair | 500 | 180M+ | ₹2.833T | ~$5.7B |
| IndiGo | 300 | 90M+ | ₹2.259T | ~$7.5B |
| Delta Air Lines | 900 | 200M+ | ₹3.240T | ~$3.6B |
| Southwest Airlines | 750 | 130M+ | ₹1.451T | ~$1.9B |
| American Airlines | 900+ | 200M+ | Lower than Delta | ~$2.8B |
Ryanair’s extraordinary per-aircraft valuation reflects ultra-low-cost operations generating 20%+ operating margins, double legacy carrier levels, despite flying smaller aircraft.
Emirates (government-owned, no public stock) operates 260+ widebody aircraft including 120+ Airbus A380s carrying 50+ million passengers. Analysts estimate valuation could exceed $50 billion if publicly traded, reflecting premium positioning and brand strength.
IndiGo’s $7.5 billion per-aircraft valuation reflects investor confidence in India’s growth trajectory and dominant market position creating pricing power superior to larger global competitors.
These comparisons reveal investors prioritize return on capital, margin stability, and growth prospects over absolute size. Airlines generating high returns on modest capital bases command premium valuations while larger carriers with significant capital intensity trade at discounts.
Airlines to Watch: Investment Considerations
Growth-Oriented Airlines
IndiGo provides pure-play exposure to Indian aviation expansion as the country’s middle class grows and infrastructure develops. India’s per-capita flying rates remain fractional compared to developed markets, suggesting substantial long-term runway.
Ryanair represents European growth through market share capture. The carrier’s cost advantages and Boeing order book provide competitive moat protection while continuing legacy carrier share gains.
Stability-Focused Airlines
Delta Air Lines offers defensive characteristics through diversified revenue streams and established market positions. The carrier’s integrated business model including loyalty programs and maintenance operations creates revenue stability and margin protection.
Singapore Airlines combines operational excellence with strategic positioning, creating a quality franchise commanding consistent yield premiums. Young fleet, premium service reputation, and Singapore hub support above-average margins.
Dividend Considerations
Most airlines focus on share buybacks rather than dividends, providing flexibility during downturns. Ryanair returns substantial capital through special dividends when balance sheet strength permits. Singapore Airlines historically paid consistent dividends with resumption expected as profitability normalizes.
Investment Risk Warning: Airline stocks historically show high volatility and cyclicality. Economic recessions, fuel price spikes, pandemics, or external shocks create rapid valuation changes. Successful airline investing requires either market-timing ability or long-term holding horizons accepting volatility.
For insurance considerations affecting airline operations, review aircraft insurance companies.
Market Outlook: 2025-2030
Global Demand Projections
Global passenger numbers expected to exceed 5 billion annually by 2030, representing 30%+ growth from 2024 levels. Growth concentrates in Asia-Pacific and emerging markets rather than mature North American and European networks.
China’s domestic market could surpass the United States as world’s largest by 2030 as Chinese per-capita flying increases. India’s aviation market may become third-largest globally, growing 8-10% annually as infrastructure improves.
Narrowbody vs Widebody Market Dynamics
Narrowbody dominance continues through 2030 as point-to-point flying and secondary city connections grow. Boeing 737 MAX and Airbus A320neo family provide range and efficiency enabling transatlantic routes without widebody economics.
Widebody demand concentrates on ultra-long-haul routes where smaller aircraft cannot operate efficiently and high-density short-haul markets. Airlines retire older fuel-inefficient widebodies including Boeing 747 and Airbus A380 faster than replacing them.
Low-Cost Carrier Expansion
Europe’s low-cost penetration already exceeds 40% and could reach 50% by 2030. US low-cost and ultra-low-cost carriers may increase from 30% toward 40% market share. Asia-Pacific low-cost penetration should increase from 30% toward 40%+ as regional carriers expand.
Sustainability Pressures
European Union carbon pricing mechanisms impact carrier economics with costs expected to increase significantly by 2030. Sustainable Aviation Fuel (SAF) currently costs 2-4x conventional jet fuel, creating potential annual cost increases of $20-40 billion if airlines meet 10% blending targets.
Airlines operating fuel-efficient new-technology aircraft enjoy competitive advantages over carriers flying older equipment. For more on SAF developments, read about sustainable aviation fuel adoption.
Consolidation Opportunities
Further consolidation in fragmented markets including Europe, Asia, and Latin America could follow US consolidation improving industry economics. Cross-border combinations may increase as governments relax ownership restrictions.
Conclusion
The 2025 global airline market capitalization landscape reveals clear industry winners through operational efficiency, strategic positioning, and financial discipline. US carriers maintain valuation leadership through domestic market scale, industry consolidation, and highly profitable loyalty programs creating competitive moats.
Low-cost carriers including Ryanair and IndiGo command premium valuations reflecting superior margins and exposure to structural growth trends. European and Asian carriers face strategic pressures requiring careful positioning to maintain investor confidence.
Market cap rankings provide valuable insights into which airline business models and geographic markets investors believe will generate superior returns. The divergence between market cap and operational size metrics confirms that return on capital and profitability matter more than absolute volume in determining long-term value creation.
As the industry navigates sustainability requirements, technological advances, and evolving demand patterns through 2030, airlines with efficient cost structures, modern fleets, strong balance sheets, and exposure to high-growth markets appear best positioned for continued success.